VirGeo® in Offshore Wind
Continuous Geo-data across the entire asset lifecycle.

Offshore wind
A wind farm runs for 25 to 35 years, once life extension is counted. Geo-data starts accumulating years before the first foundation goes in, and it doesn't stop until the last inspection campaign.
Geophysics, geotechnics, metocean, environmental. Different resolutions, different vintages, held by different teams in different software. Every decision comes out of some part of it: where to survey, where to place a foundation, where to route a cable, and years later, what to show the regulator when they ask why.
VirGeo® holds all of that in one spatially organised workspace, whoever acquired it. Where it fits, stage by stage:
Screening
Site characterisation
Integrated ground model
Permitting
Engineering design
Installation
O&M
Extension and decommissioning
Across the lifecycle
The questions change as a project moves from development to operations. The material they rest on stays the same.
Data arrives from different domains, at different resolutions, from different years, at very different quality. Some of it is authoritative. Some is a rough frame of reference from a survey nobody would rely on today. The difference has to stay visible, because it decides how much weight a dataset carries in a decision.
Nobody is a specialist in everything. Geoscientists, engineers, environmental leads, project managers and regulators all read the same site, and most of them don't have GIS skills.
The reason behind a decision outlasts the decision. Someone asks, years later, and the answer is in the data if anyone can still find which part.
The volume only grows. Site selection starts with regional coverage and 15-year-old surveys. By O&M there's seismic, point clouds and decades of inspection campaigns.
Initial site selection
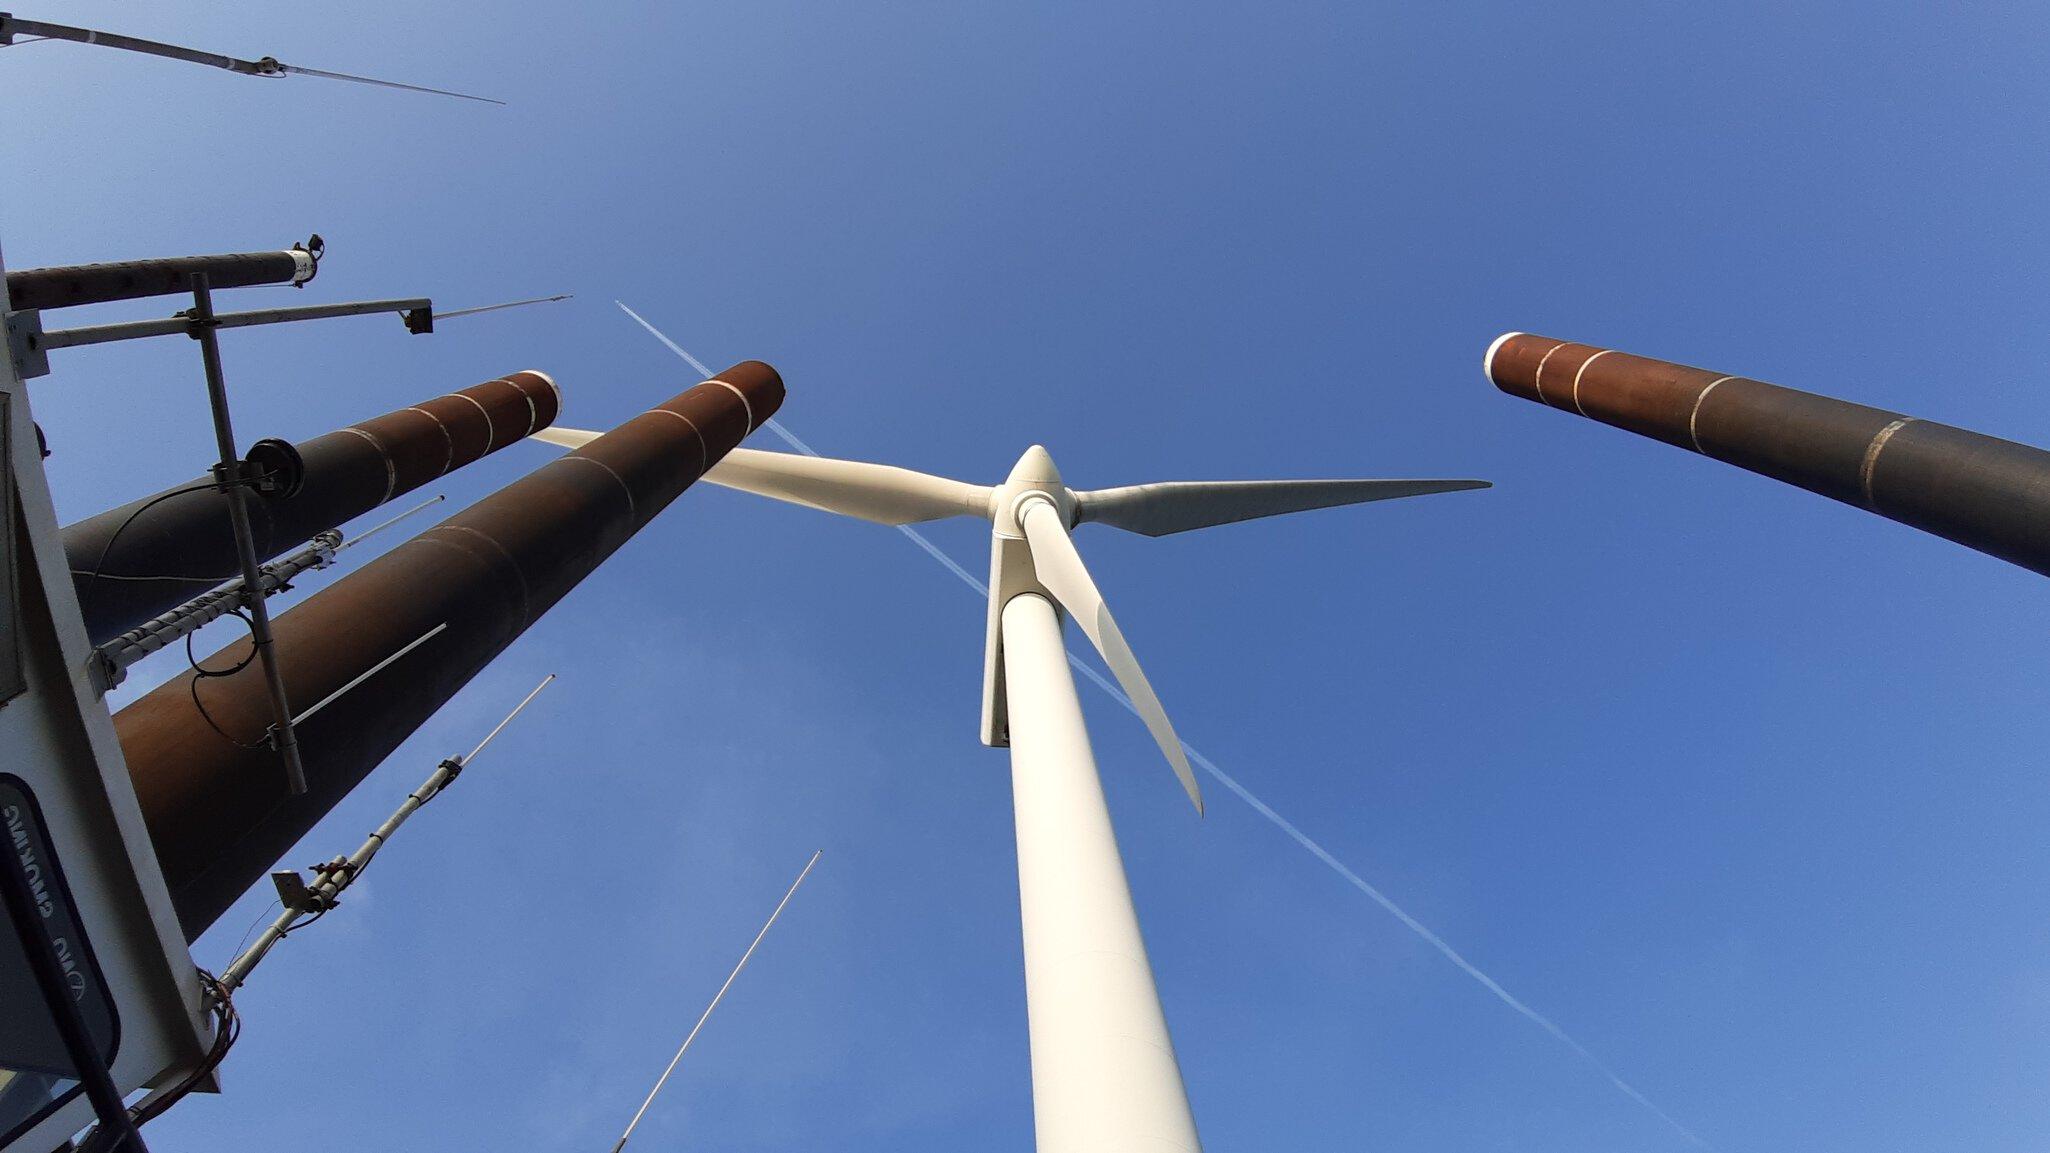
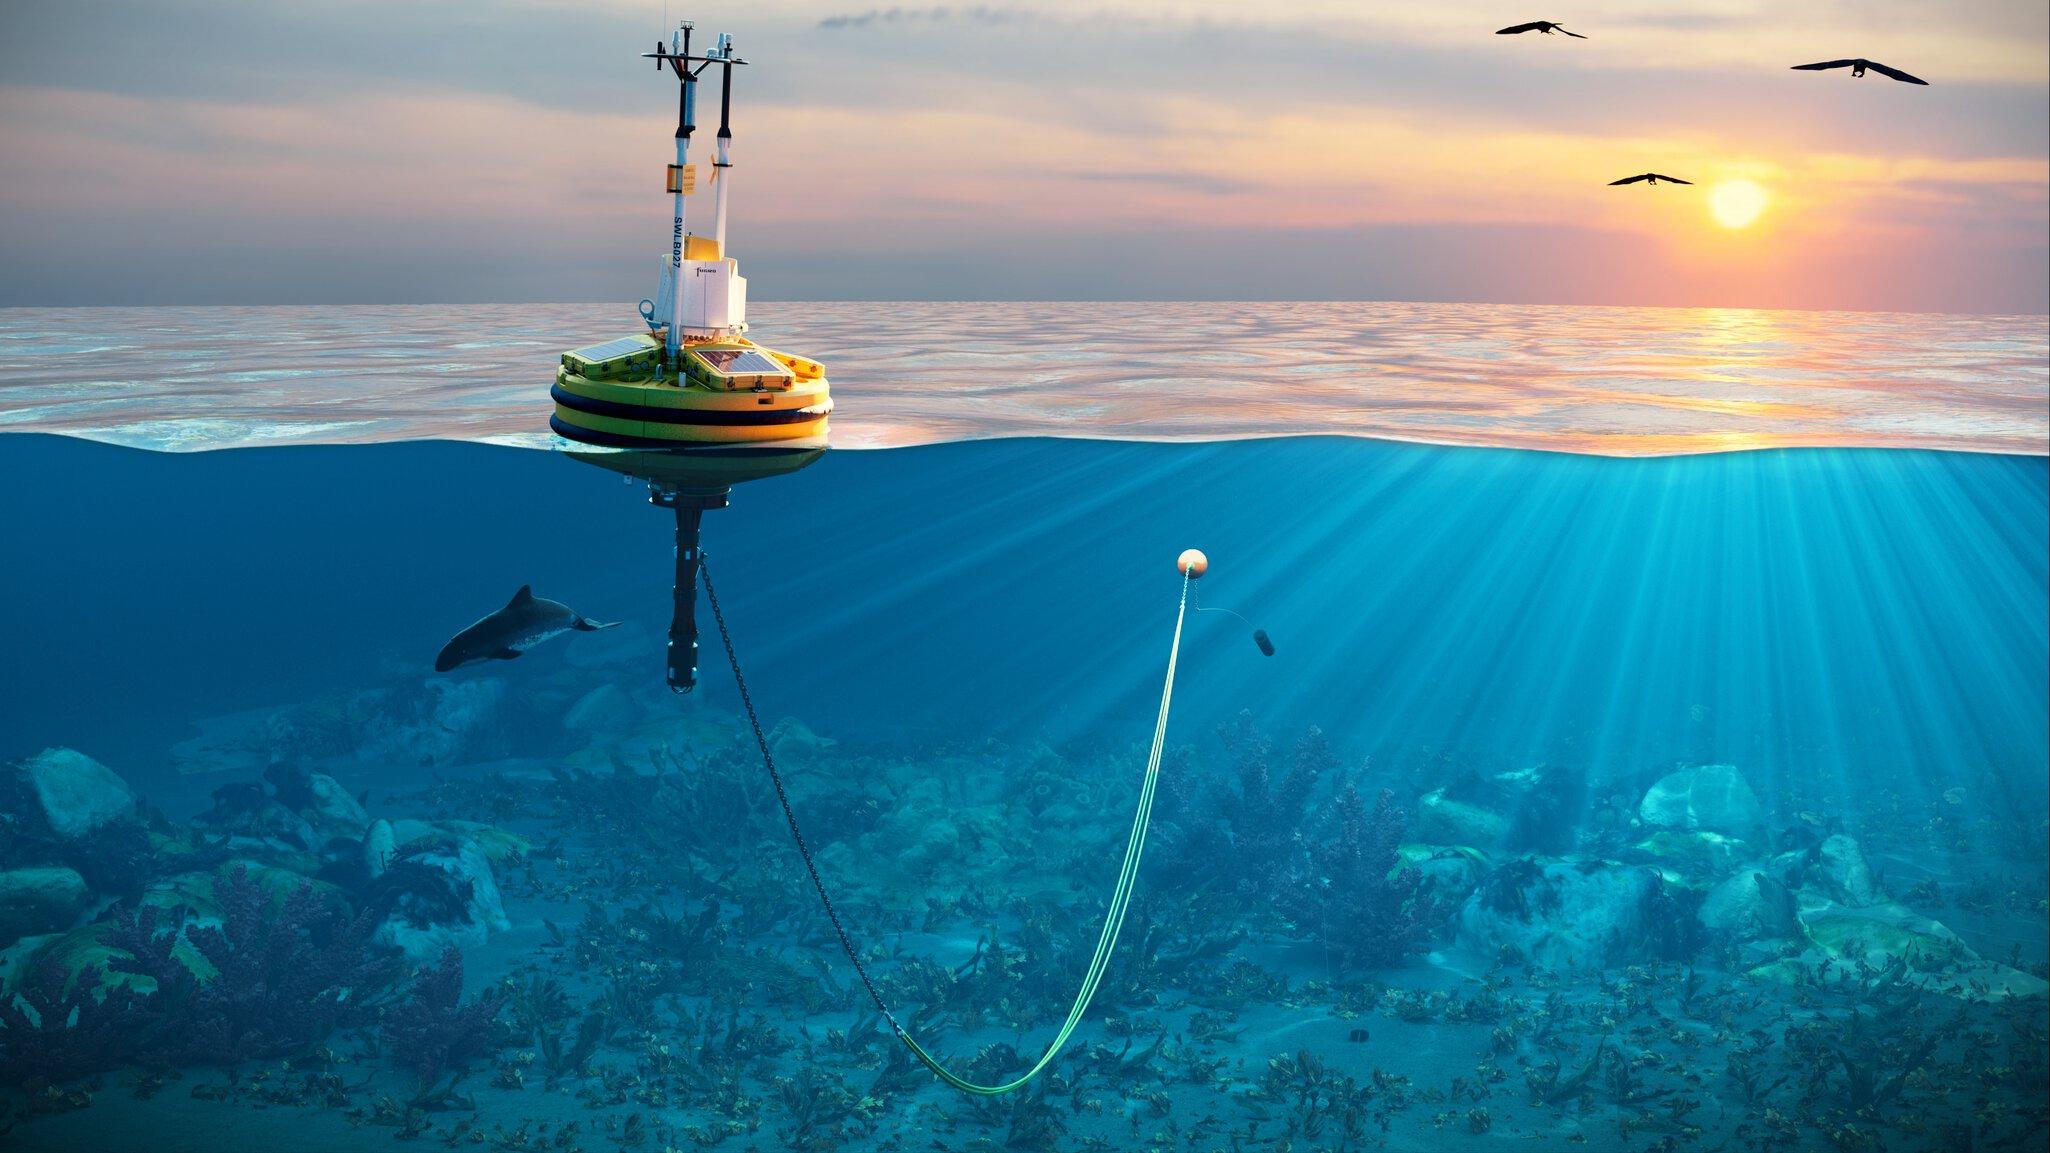
Site selection weighs a lease area against everything that can be known before committing to it: wind resource, water depth, seabed and subsurface conditions, sensitive habitats and migratory routes, fishing grounds and other sea users, distance to a viable grid connection. A floating LiDAR buoy goes in early to measure wind, waves and currents for the resource case. Alongside it, a low-resolution geophysical pass maps the seabed and the obvious no-go zones, and the desktop study starts to take shape.
The evidence in that desktop study carries very different weight: poorly gridded bathymetry that only gives a frame of reference, a geophysical survey from 15 years ago reprocessed over the areas that matter, raw multibeam backscatter that nobody has processed yet. GIS is the natural place to bring it together, but it only reads certain formats, and reports, engineering data and sample records don't drop onto a map by themselves. So each specialist keeps their piece in their own software, and the screening decision rests on evidence nobody has organised.
In VirGeo the desktop study's evidence base sits in one workspace: data goes in without reformatting, tagged for its quality and vintage, readable spatially by every discipline that has to weigh it. The reprocessed survey and the rough bathymetry sit on the same map without being mistaken for each other. And the reasoning stays attached. 3 years on, with vessels in the field, someone needs to know why an area was ruled out.
Screening
Screening turns broad areas into a risk picture. Fault activity, steep slopes, shallow gas, seep features, mobile sediments and migrating sandwaves; protected habitats and seasonal restrictions; wrecks and unexploded ordnance along candidate cable corridors. Against those constraints the first infrastructure concepts take shape: how many turbines the capacity target implies, how they sit on the site, whether an export cable can feasibly reach the interconnection point.
Each risk sets its own data requirement, and together they produce the survey plan: where high-resolution coverage is needed, where regional data will do, what the geotechnical campaign has to sample. The multi-criteria analysis runs again with the concepts laid over the constraints.
In VirGeo the constraint layers and the infrastructure concepts sit on the same map, in the same catalogue site selection built. The survey plan gets drawn against layers everyone involved can already see. When a candidate corridor crosses a known UXO risk area and gets rerouted, the reason for the reroute sits on the same map as the new line, where the survey planners and later the permitting team will look for it.
Site characterisation
The survey campaigns exist to answer installation's questions: can a foundation be driven here, how deep does a cable have to be buried there, which locations need to move. Multiple vessels work the site at once: geophysical on the export corridor, geotechnical in the turbine zone, environmental sampling on its own cycle. Between them they bring back multibeam bathymetry, side-scan sonar, sub-bottom and seismic profiles, magnetometer data, CPTs and borehole samples, and grab samples and seabed imagery for the benthic baseline.
The deliverables arrive on different clocks. 24-hour reports from the vessels. Sea state plots every 4 hours. Daily environmental sampling. An AUV that surfaces after 24 hours with a data dump. Without somewhere central, the team experts reconstruct the campaign by hand: GIS for the mapping, Kingdom for the subsurface, email for how many metres were drilled since yesterday. On the older pattern, a 4 to 8 week programme ends with a hard drive coming off the vessel, which is the first moment anyone sees that a whole area has to be avoided.
In VirGeo the incoming stream is the operational picture: what has landed, where the assets are, what the new data shows. On Revolution Wind, for Ørsted and Eversource, VirGeo gave every project stakeholder 24-hour access to the site's Geo-data, updated in near real time, through a site characterisation campaign across a boulder-rich glacial moraine. On a deepwater site with complex geology and potential geohazards across the seabed, that visibility is what lets you send the AUV back over an area of concern while the vessel is still on station. The alternative is finding out 6 weeks later and mobilising again.
There are always diversions from the survey plan. The question is how long it takes to see one coming.

Building the integrated ground model
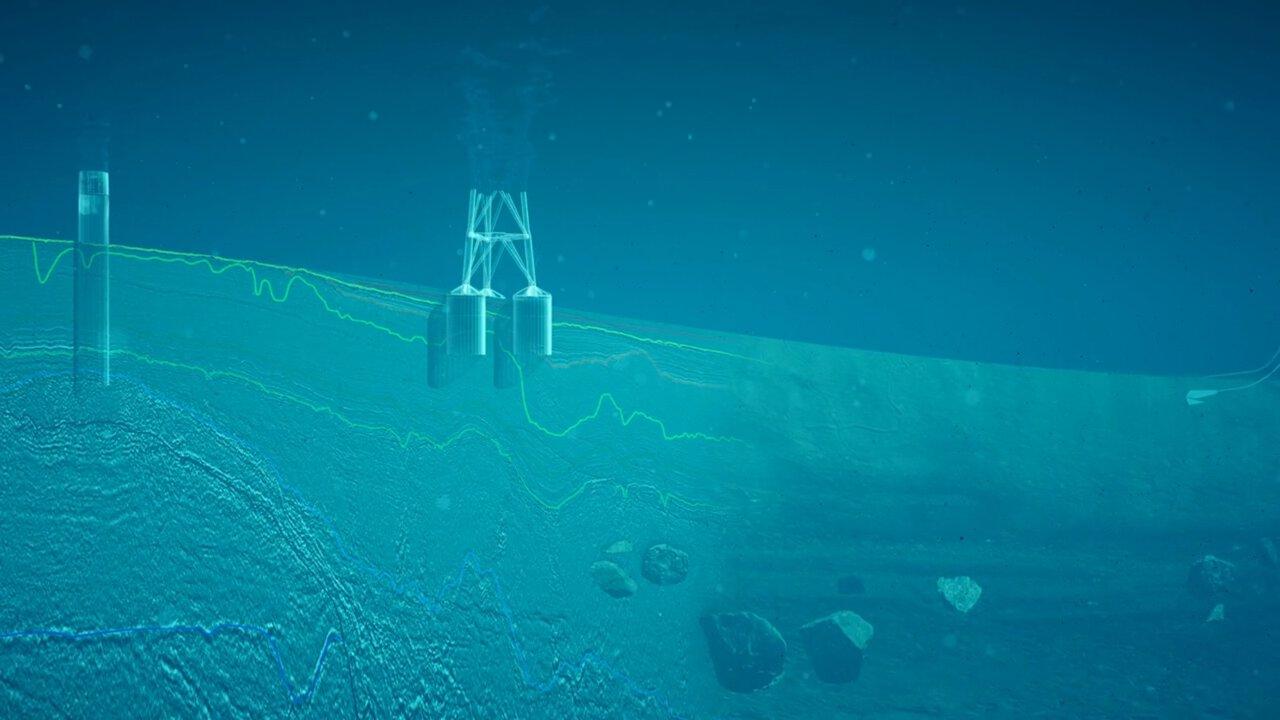
Interpretation brings the campaign data together into an integrated ground model connecting the subsurface layers from the seismic, tied to soil properties at the CPT and borehole locations, how those conditions vary across the site, and what that means for infrastructure placement. For a cable, placement and burial depth are a balance. The equipment can only bend so far and has to be buried deep enough to survive anchors and fishing gear, but not so deep that it struggles to dissipate heat. High thermal resistivity can drive changes to the route, burial target or conductor size. Where migrating sandwaves were flagged during the screening stage, the burial target needs to account for the lowest seabed level they are expected to reach over the life of the asset. A weak soil layer beneath a planned foundation might move the foundation altogether. Each risk flagged during screening either closes here or triggers further investigation.
None of it is one calculation in one package. Engineering mathematics gets applied to spatial geometry across specialist software, and the results come back together as advice: a revised cable route, a moved foundation, a list of what still needs investigating.
VirGeo acts as the integrating layer across this workflow. The specialist analysis still occurs in geophysical, geotechnical or engineering software, but VirGeo connects the underlying data, spatial context, interpretation and outputs as the ground model develops. The catalogue built through site selection, screening and site characterisation now connects to an integrated understanding of the earth: what was measured, what was inferred between measurements, and what that means for the infrastructure.
The ground model becomes the basis for the engineering decisions that follow, with the evidence behind it still connected and preserved. This continuity matters at the permitting stage. Someone may need to reassemble the evidence behind a decision made years earlier by a team that has since moved on. Rather than piecing the evidence together from different systems, files and teams, VirGeo keeps the ground model connected to the underlying data, interpretation, and decision context.
Permitting
Before a project is cleared for construction, the regulator wants the decisions in the consent application and the evidence behind them. The submission goes in: foundation design, cable placement, environmental baselining and a monitoring plan for the future. Six months to a year later, what comes back is usually a set of revisions, and some of those can mean adjustments to infrastructure planning, which may result in more survey and more studies.
It's iterative. Most of the back and forth with the permitting coordinator is about why: why the infrastructure concept looks the way it does, why a habitat was sampled in that season, why an area was avoided.
The regulator is also not one body. Alongside the national permitting authority sit fisheries organisations, environmental agencies, local communities and indigenous groups, all owed due diligence. And the requirements move while the programme runs.
Commonly, most of that evidence travels as a bulk transfer or a set of drives, after which the regulator reads massive reports to work out where the data physically sits. On Atlantic Shores, the first digital deliverables to the federal regulators went through VirGeo, alongside the thousands of pages of reports that permitting standards still require, years of complex work from the various development teams for marine site investigation. The same workspace can carry evidence in a form a single stakeholder group can browse spatially: on one project, the discussion was about giving the tribal authority direct access to the sampling record and the images of the physical samples, so they could judge the historical significance themselves.
Engineering design
Detailed design converts the ground model into steel: foundation dimensions, cable specification, installation tolerances, determined in bespoke engineering software against standards like DNV-ST-0126. The cost lever is uncertainty. Where the ground model is thin, the design carries conservatism, and conservatism is measured in steel, vessel time and cable length.
VirGeo has no role in the design work itself; finite element analysis runs where it runs, and pushing results back in afterwards would be a step without a gain. Its part is upstream: the design team pulls from the same record the development team built, rather than from whatever survived the handover.
Installation
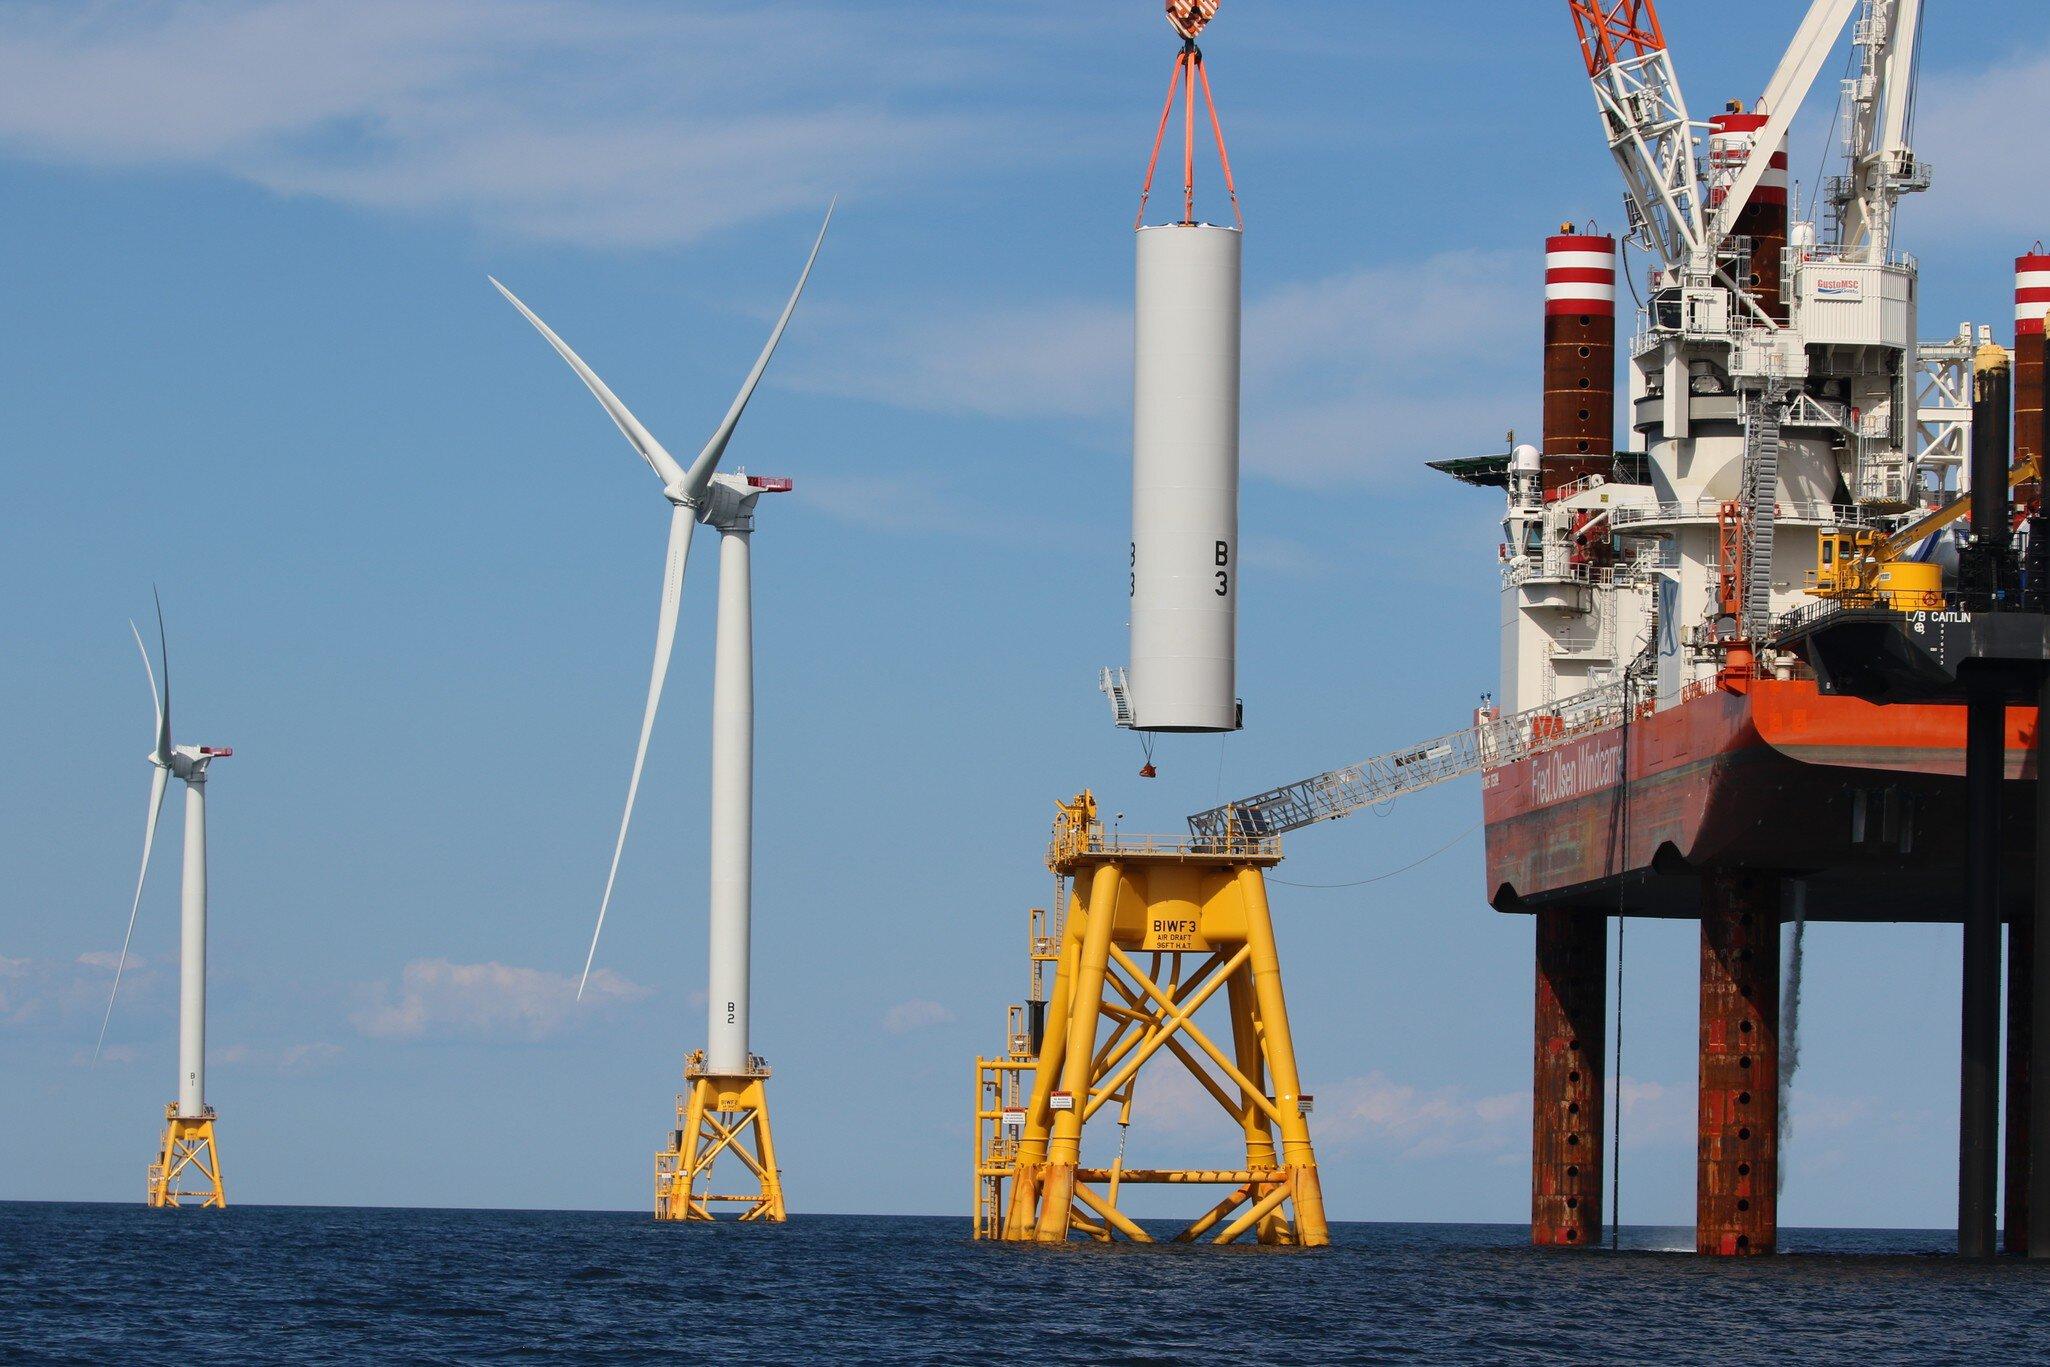
Before FID, the construction packages go out to tender: contractors bidding to lay cable and drive foundations, each needing the context of 5 years of survey work before they're hired. FID waits on their prices. Nobody walks 6 bidders through it individually. The current answer is drives, and each contractor rebuilding the same picture in their own GIS. Or the bidders get access to the workspace where the record already sits, scoped to what they need.
Where sandwaves cross the route, the crests may have to be pre-swept before the cable goes in, and the pre-lay survey shows how far they have moved since the campaign that first mapped them. The installation campaign itself runs on the contractor's systems, and VirGeo has no role in it. What it holds is everything that precedes the build: the surveyed seabed, the mapped constraints, and the reasoning behind every location the contractor is about to work on.
O&M
Once the asset is operational, the questions turn to its current state and how its integrity develops over time. Inspection programmes run on intervals that differ by asset type, often set in the licence conditions, and the point of them is comparison: this year against last, this season against the same season 3 years ago, with the repairs in between.
Scour pits around the foundations and the condition of the scour protection. Cables that have lost cover: where sandwaves migrate, a cable buried to target depth at installation can lie exposed a few years later, and the inspection question is how much cover is left compared with the as-laid survey. Marine growth on the foundations, which leads to corrosion studies. The data is heavy: point clouds detailed enough to see the change. Time becomes the main axis, and 3D matters more than it did during site characterisation.
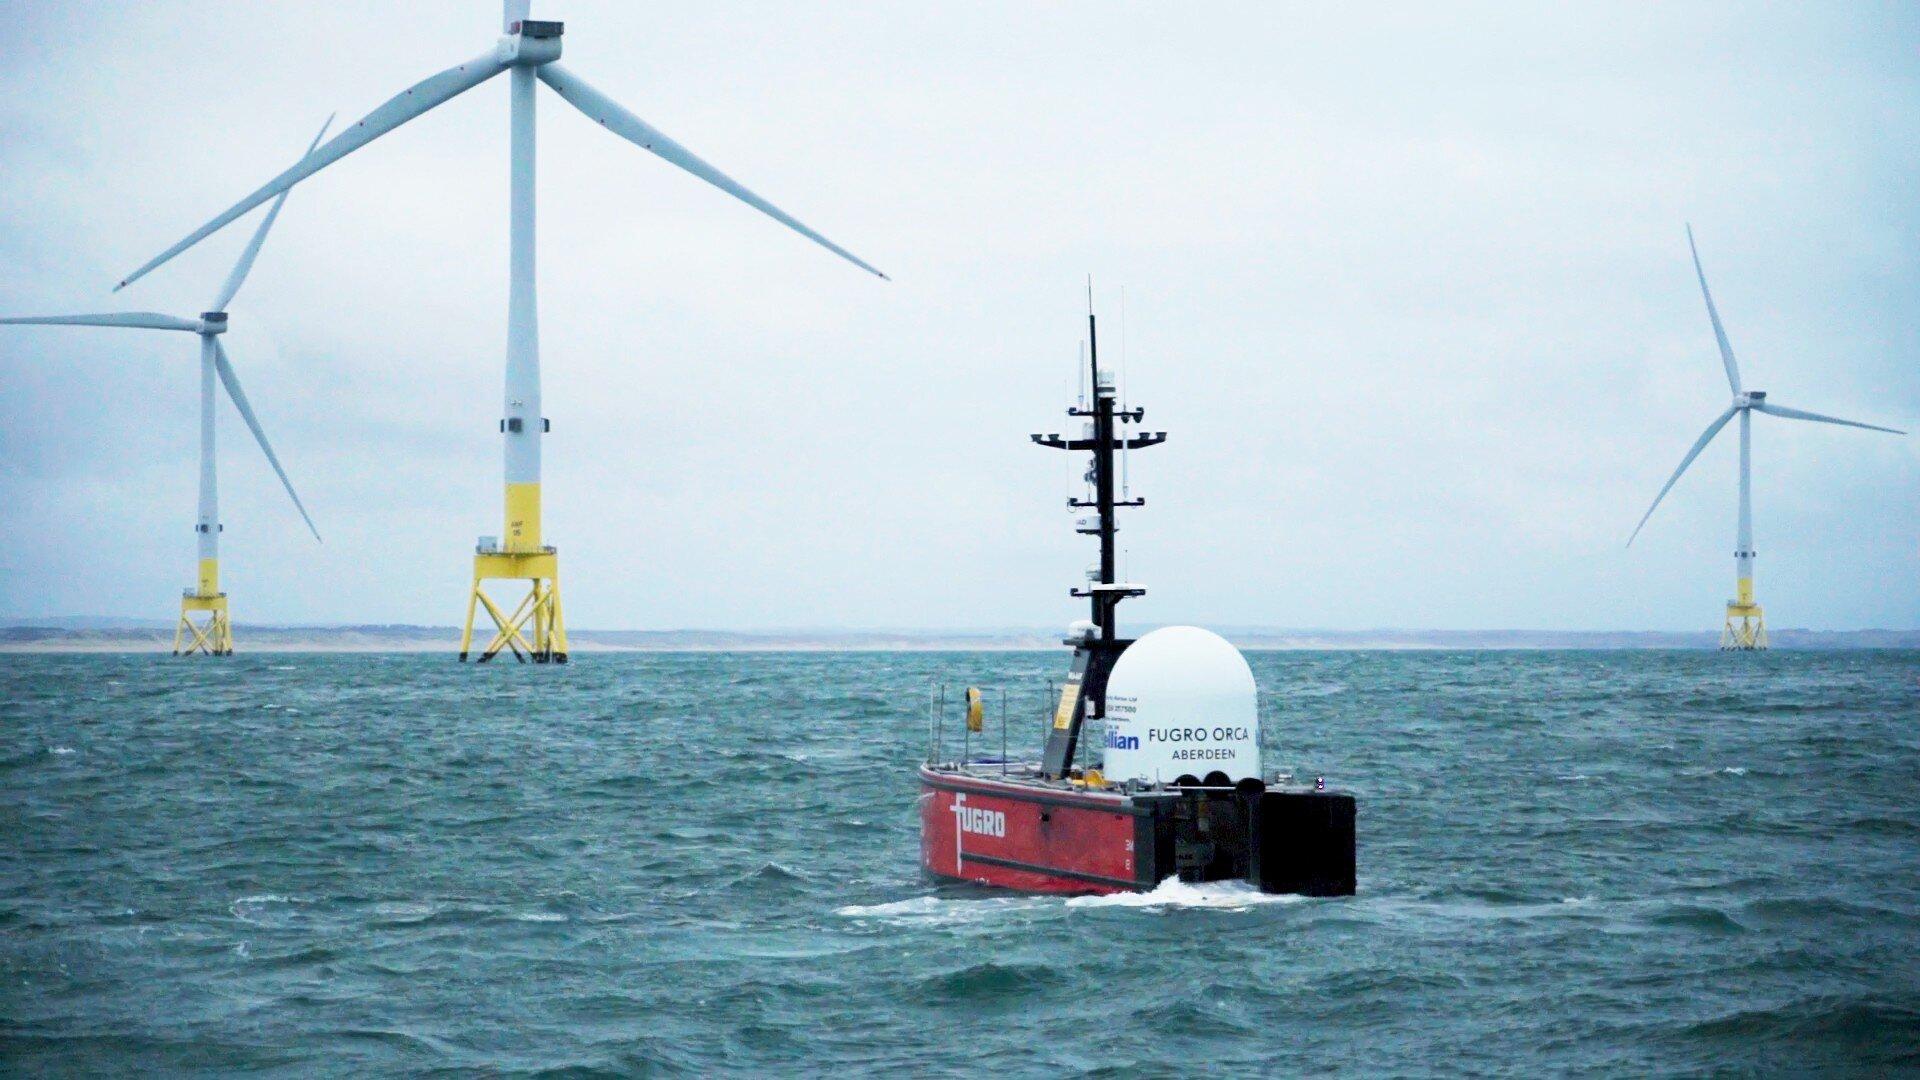
VirGeo is early in this phase. A video feed from the USV and its vessel track were recently added, which is how you keep eyes on an unmanned vehicle running an inspection campaign. Inspection data also has to reach the regulator at fixed intervals for the life of the asset, and hosting that is work VirGeo is suited to. Beyond that, this isn't yet where the platform's strength is.
Extension and decommissioning
A wind farm reaching year 20 faces a decision built entirely on records: whether the foundations, cables and turbines can carry another 5 or 10 years past their design life. The case for extension compares the original design assumptions with what 2 decades of inspection actually found. Removal runs on the same material in the other direction: what was installed, what was buried, what condition it's in now, and what the seabed has to be returned to.
Both depend on data collected up to 30 years earlier, in formats that were current when the permit was granted. Whether that record is still findable and readable gets decided much earlier in the lifecycle than anyone making the extension case would like.
What survives the handovers
A project this long outlives its teams. Development hands over to engineering, engineering to construction, construction to operations, and the asset itself may change owners along the way.
What carries across every handover is the Geo-data record. How much of it survives depends on where it lives.
VirGeo®
VirGeo® integrates geo-data management, insights and visual geospatial context in a single location for connected workflows and collaboration across project teams.
Single source of truth
eliminates version confusion, data silos, and scattered FTP deliveries
Accelerated decision-making
Real-time data access replaces waiting for periodic deliverables
Geospatial context
Every file linked to a map location for intuitive navigation and discovery
Enterprise-grade security
SSO authentication, defined access control, and full audit trail
Lifecycle continuity
Data persists across personnel changes, vendor transitions, and project phases
Lower operational effort
Automated workflows replace manual file management and email-based sharing
Let’s Make Your Geo‑Data Work Smarter
See VirGeo® in action and explore how it supports secure delivery, enterprise governance, and long‑term data value—built on Fugro’s domain expertise.
Book a demo

Platform modules
VirGeo®’s modular platform allows you to configure each workspace according to the asset’s needs.
Data Exchange
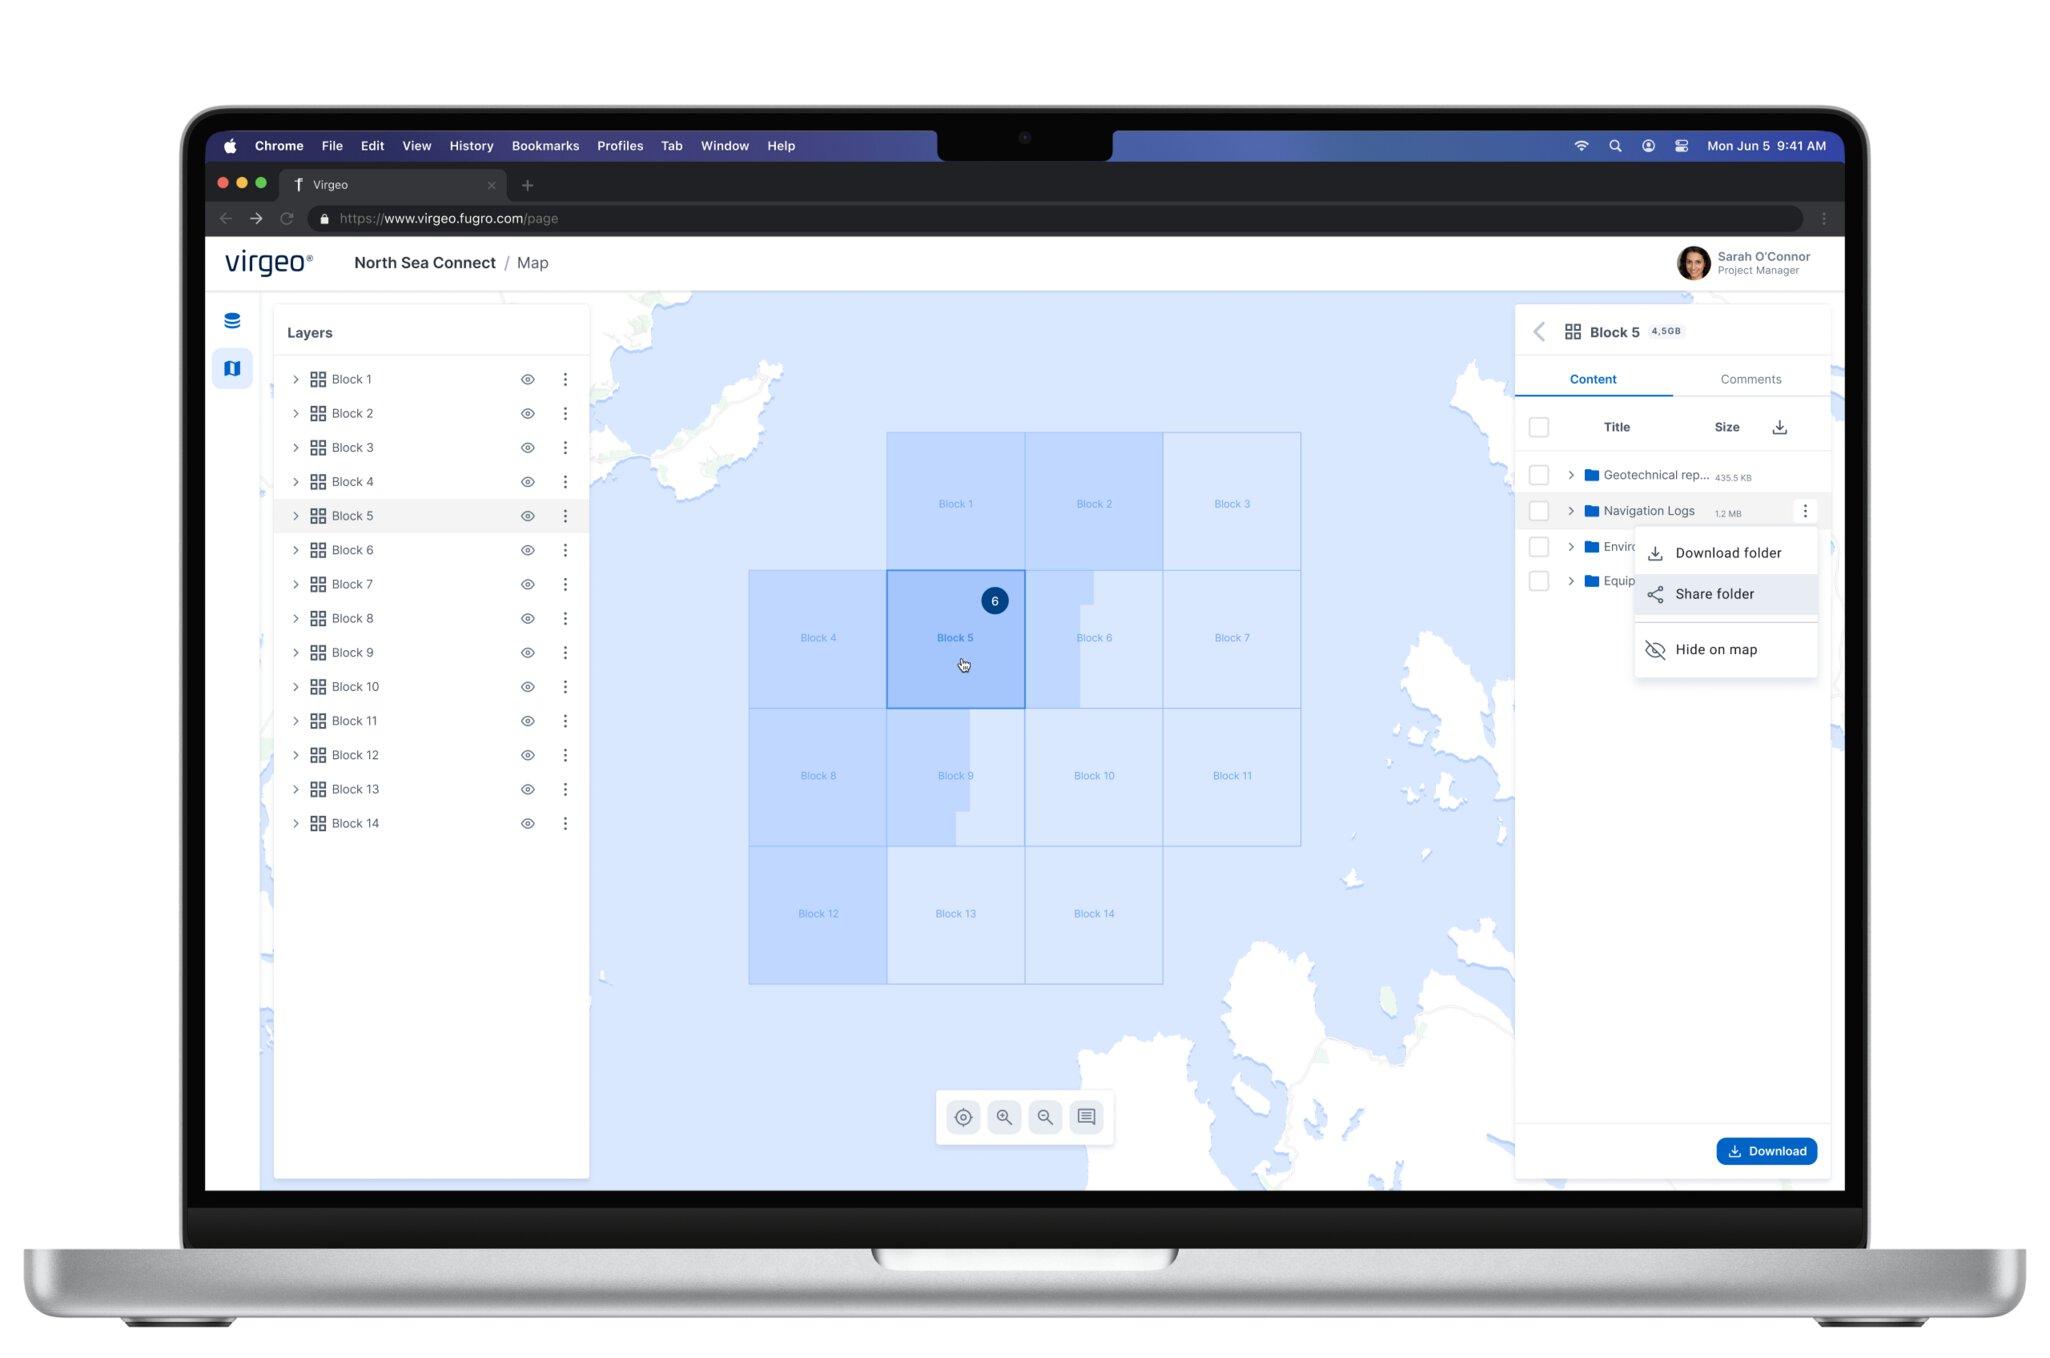
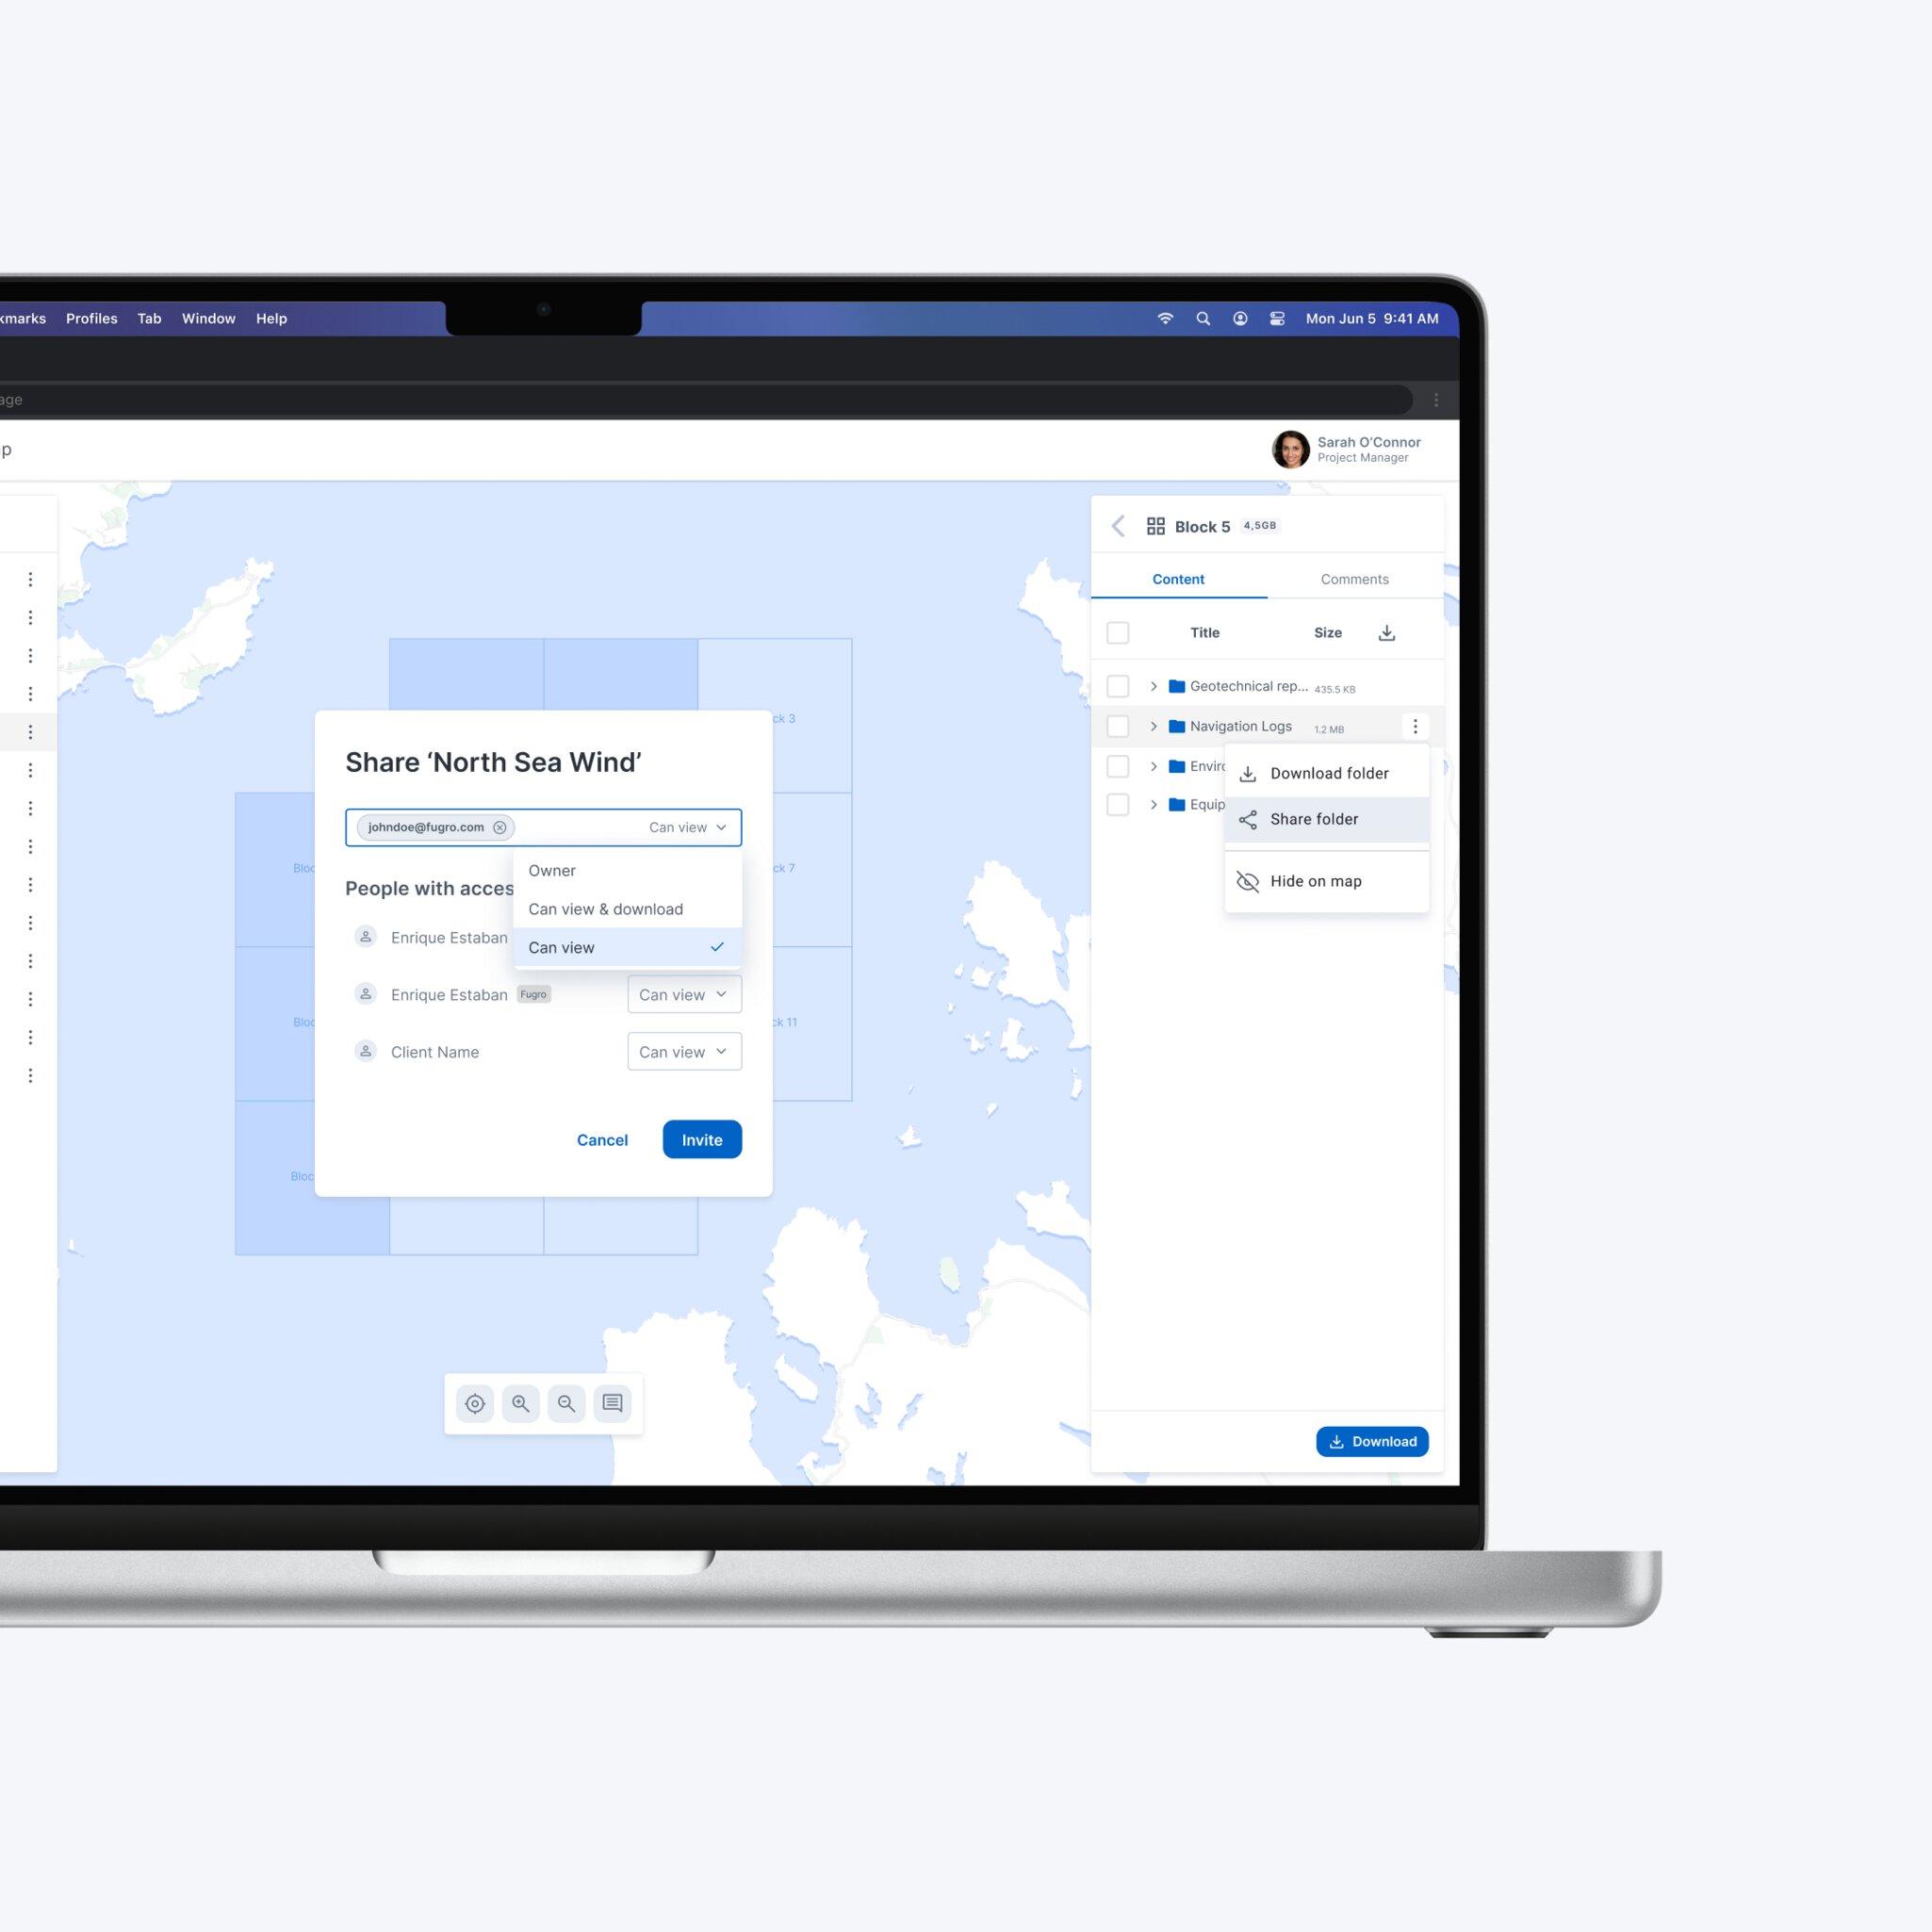
Securely upload, organise, and share geo-data files in a structured, project-based workspace
- Link files directly to GIS locations on an interactive map, enabling intuitive spatial navigation, click a location, instantly access all associated deliverables.
- Preview GeoTIFFs, multibeam bathymetry, videos, PDFs, and other specialist formats directly in the browser - no desktop software or plugins required.
- Apply granular access permissions at folder or file level, supporting role-based access for clients, contractors, and internal teams.
- Bulk upload via drag-and-drop, with options for automatic metadata extraction.

GIS & Web Maps
Add web maps into your workspace - showcasing GIS data directly for quick decision making.
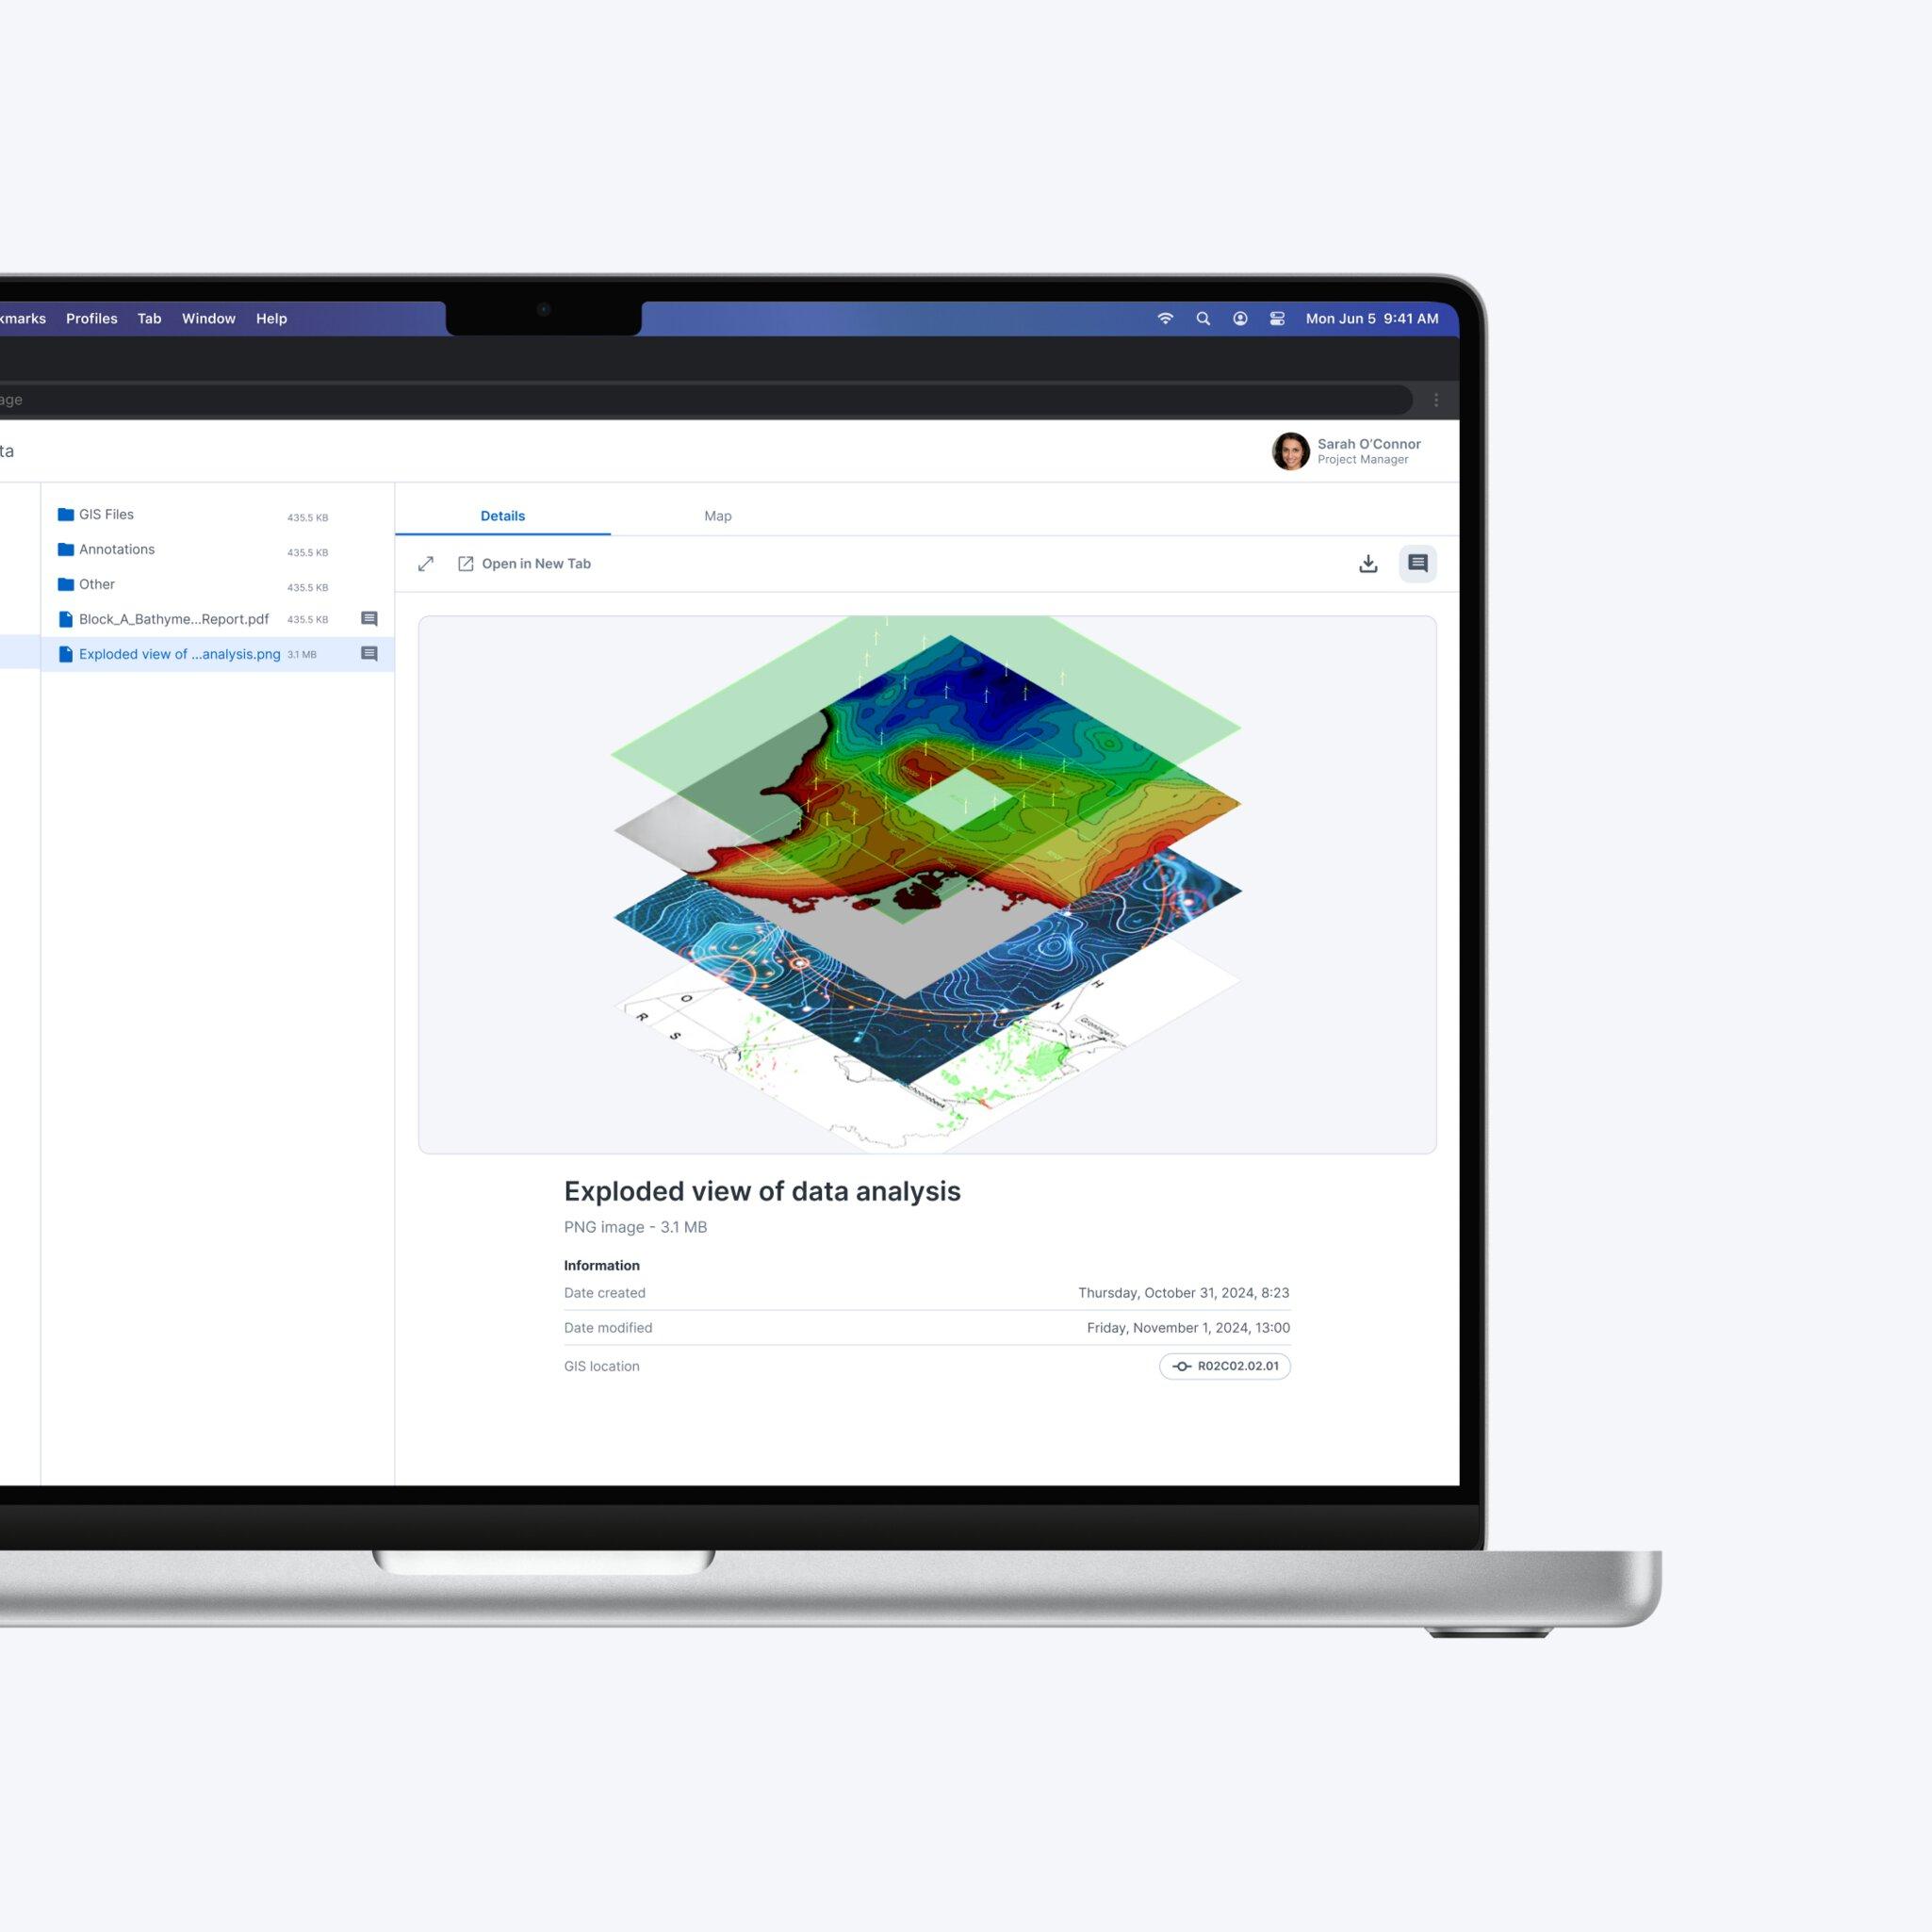
- Navigate multi-layer maps with intuitive controls, built-in legends, feature pop-ups, and analytics tools (distance, area, elevation profiles).
- Visualize geophysical and geotechnical survey data, geological features, and environmental layers spatially alongside your geo-data for complete project context.
- Overlay data from multiple surveys or time periods for change detection.
- Configurable base maps and coordinate reference systems to suit regional project requirements.
Survey Progress & Dashboards
Connect live data sources for real-time operational dashboards that keep all stakeholders aligned.
- Track survey progress by work package, survey line, vessel, or any custom grouping.
- Configure interactive charts and data tables to display the exact attributes, status categories and thresholds that matter to your project.
- Embed vessel and other survey vehicle tracking for near-real-time insights on survey project status and progress.
- Designed for active data acquisition management, from geotechnical and geophysical surveys to cable route and UXO programmes.

Let’s Make Your Geo‑Data Work Smarter
See VirGeo® in action and explore how it supports secure delivery, enterprise governance, and long‑term data value—built on Fugro’s domain expertise.
Book a demo